Table of Contents
- 1 General Information
- 2 Pentaho Home Page
- 3 Error Check
- 4 Required Reports
- 4.1 Enrollment Report
- 4.2 Program Status Report
- 4.2.1 Students Included in the Program Status Report
- 4.2.2 Report Breakdown
- 4.2.2.1 Student counts by Instructional Category (Unduplicated):
- 4.2.2.2 Student Counts by Instructional Categories (Duplicated)
- 4.2.2.3 Student Counts by Instructional Category
- 4.2.2.4 Demographic Breakdown by Instructional Category
- 4.2.2.5 Status
- 4.2.2.6 Self-Reported Achievements/Completions
- 4.2.2.7 Testing Information by Instructional Category and Test Type:
- 4.2.2.8 Class Detail Information:
- 4.3 NRS Performance Report
- 4.3.1 Students Included in the NRS Report
- 4.3.2 Table #1: Participants by Entering Educational Level, Ethnicity, and Sex
- 4.3.3 Table #2: Participants by Age, Ethnicity and Sex
- 4.3.4 Table #2a: Ineligible Participants by Age, Ethnicity, and Sex
- 4.3.5 Table #3: Participants by Program Type and Age
- 4.3.6 Table #3 IETP: IET Participants by Program Type and Age
- 4.3.7 Table #4: Educational Gains and Attendance by Educational Functioning Level
- 4.3.8 Table #4a: Educational Functioning Level Gain
- 4.3.9 Table #4b: Educational Gains and Attendance for Pre- and Post-tested Participants
- 4.3.10 Table #4c: Contains Participants who are Distance Learners and have at least 12 attendance hours
- 4.3.11 Table #6: Participant Status and Program Enrollment
- 4.3.12 Table #7: Adult Education Personnel
- 4.3.13 NRS Goal Table – Primary Goals
- 4.3.14 NRS Goal Table – Secondary Goals
- 4.3.15 Testing Data
- 4.4 Generating a Report
- 5 Static Reports
- 6 Ad Hoc Reports
General Information
Prefer to learn using videos? Check out this recorded training of the Reports section of DAISI.
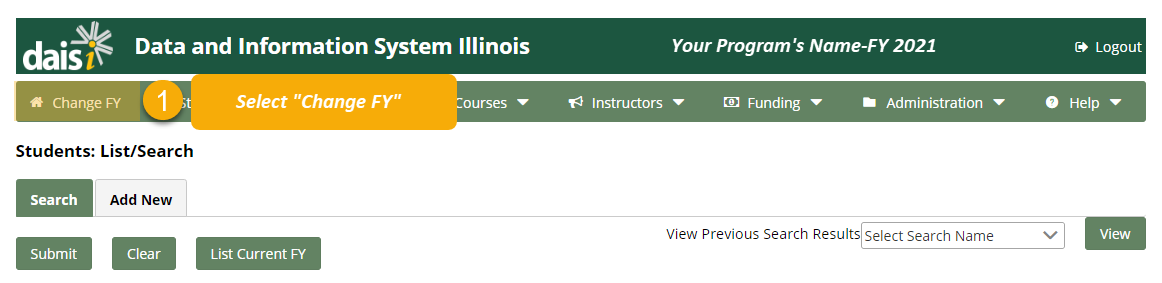
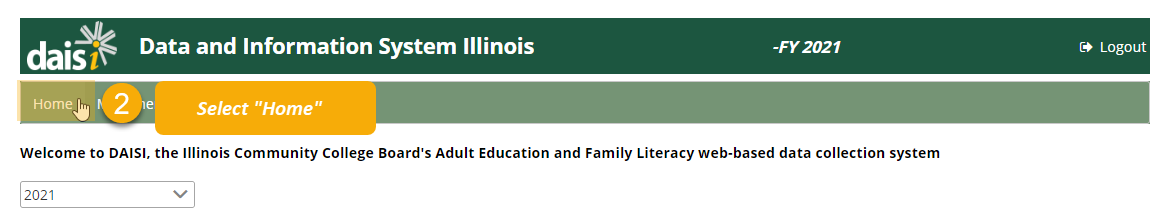
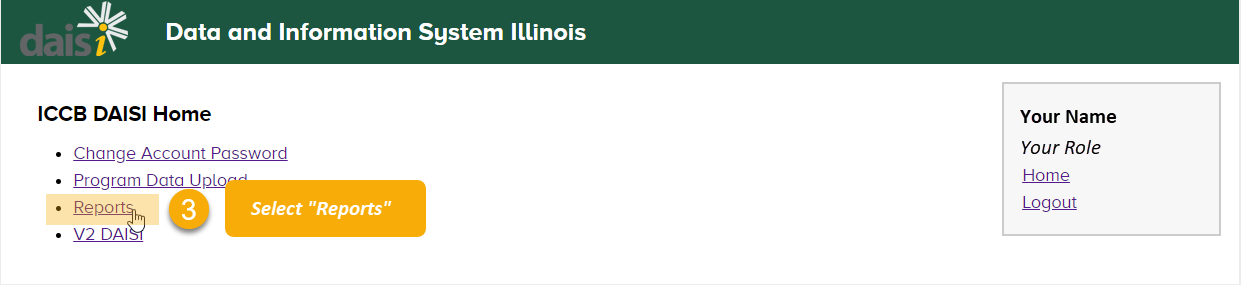
To access the reporting screen, follow the following steps:
- Select Change FY from the navigation bar.
- Select Home from the navigation bar.
- Select the Reports
Pentaho Home Page
To access the Pentaho Home Page, click the Pentaho Home Page link under the Pentaho heading of the Reports page.
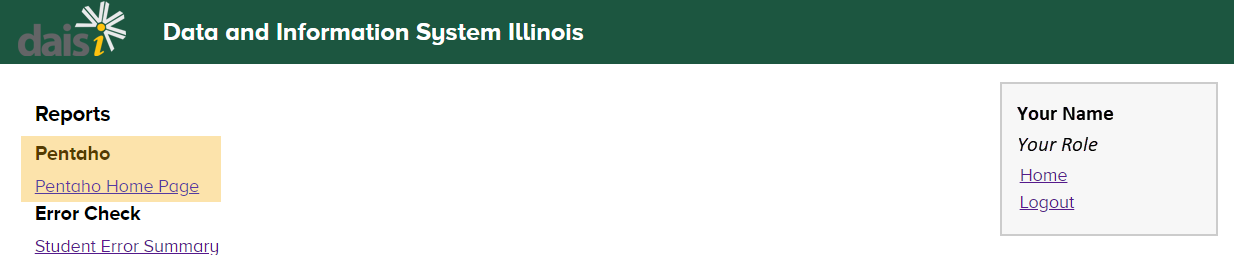
Here, you can build custom reports with data that is not included in the reports listed on the Reports home page.
Error Check
The Error Check allows you to check the validity of program data and search for errors or warnings during the selected fiscal year. There are two reports that show errors in your program’s data:
- Student Error Summary: Lists the types of errors and warnings that exist in your program’s data and the count of each error
- Student Error Details: Lists each error and warning one by one, and includes details that will help you find the error such as the student’s name and the class number
Student Error Summary
To run a student error summary report, click the Student Error Summary link on the Reports homepage.
Select the Fiscal Year, Program Name, General College (if applicable), and Output Type. Then, click View Report.
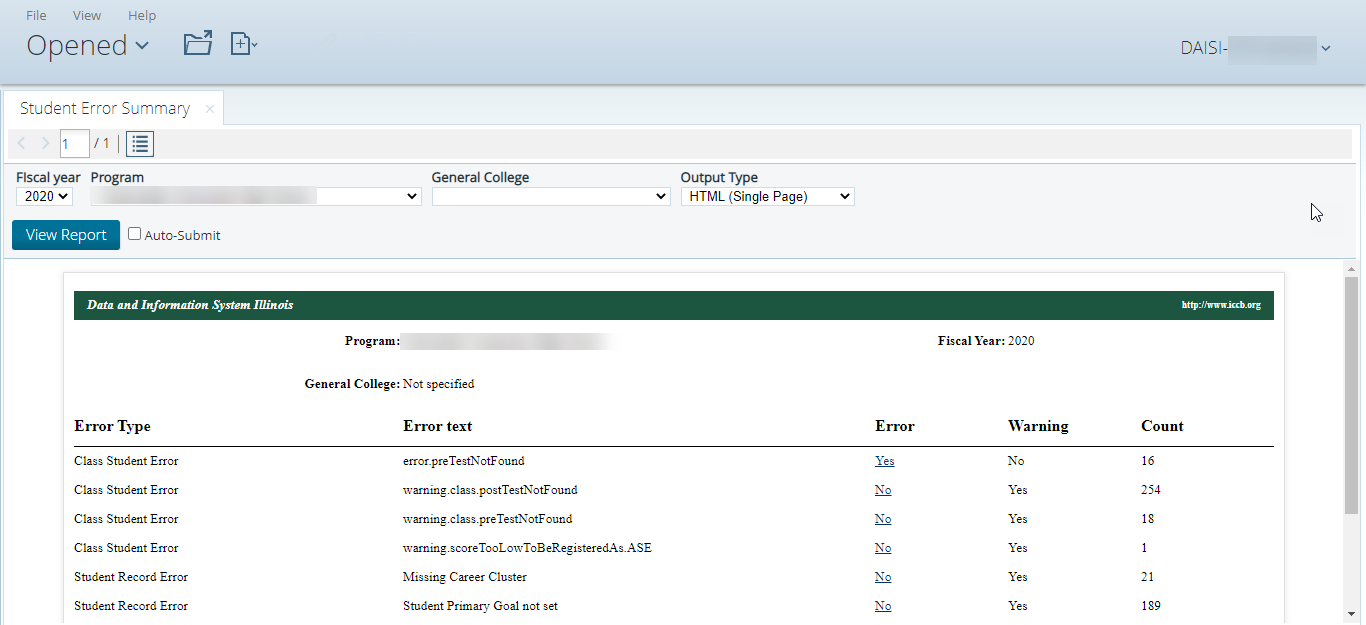
The report will either display in the bottom half of the screen or be downloaded to your computer, depending on the Output Type you chose. It will show the Error Type, Error Type, whether it’s an Error or Warning, and the count of errors of the given type.
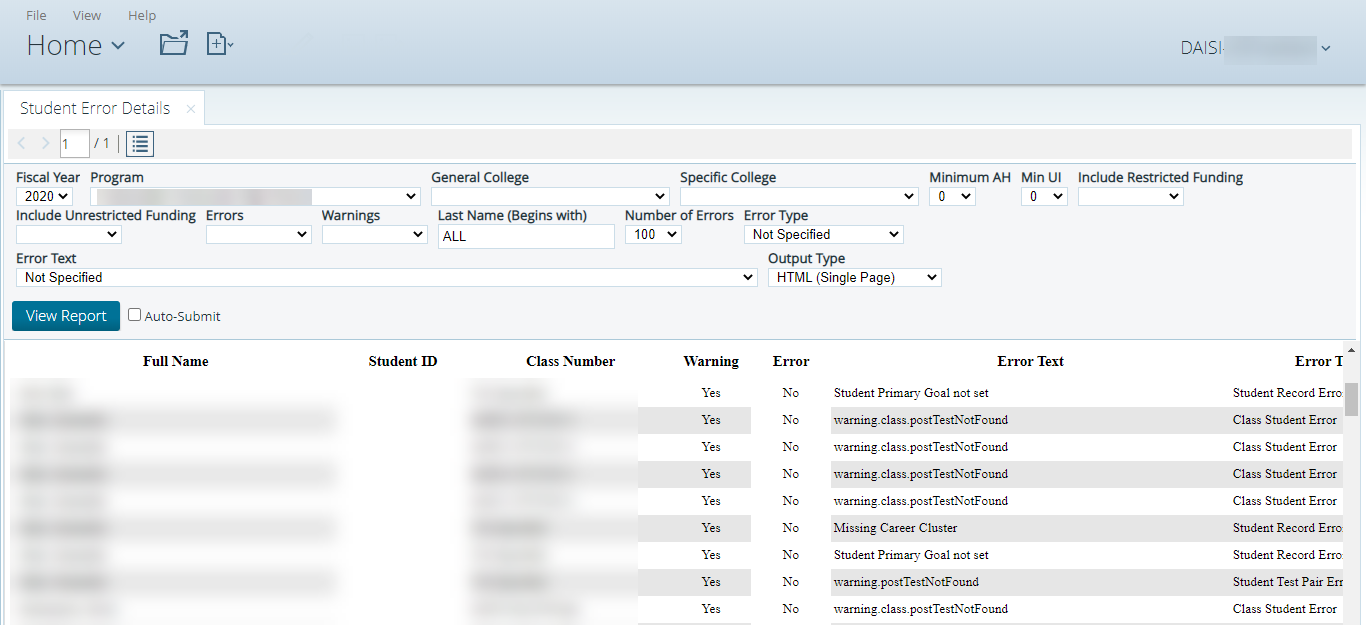
Student Error Details
To run a Student Error Details Report, click the Student Error Details link on the Reports homepage.
The screen will prompt you to enter several fields to narrow down the results in your report. Pay close attention to the Number of Errors field, and be sure it reflects all of the errors you want to see.

Click View Report, and the report will either be displayed in the bottom half of the screen or be downloaded to your computer, depending on the Output Type you selected.
Required Reports
To access the required reports, choose one of the links under the Required heading on the Reports page.
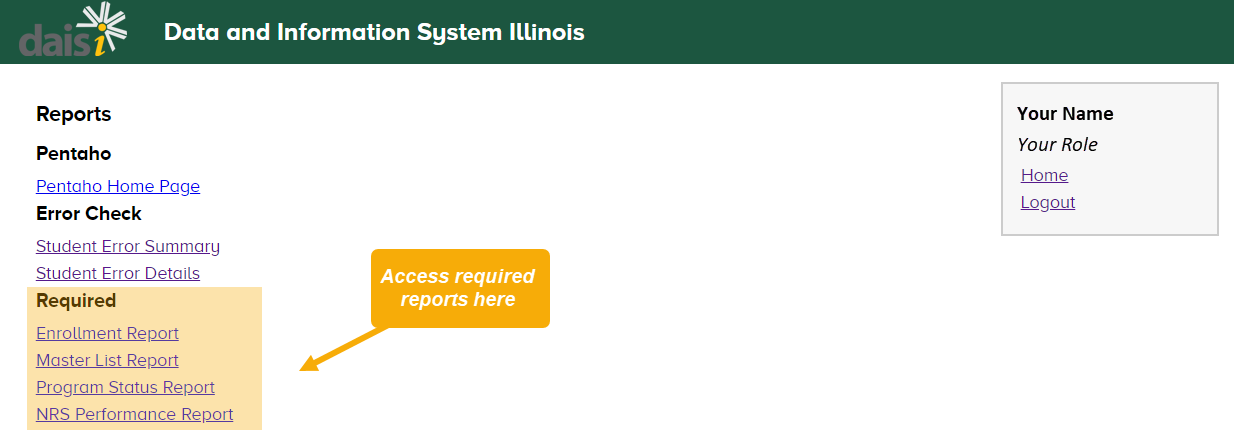
There are three required reports you can choose from:
- Enrollment Report
- Program Status Report
- NRS Performance Report
Each are explained in detail in the sections below.
Enrollment Report
The Enrollment Reports provide information about the number of students served and units generated in each instructional category by a specific funding source. These reports provide the overall total percentage generated by the funding source.
Programs are required to generate 45% of each restricted grant funding source (with the exception of State Basic and State Performance) by March 31. Programs that do not generate at 45% in a funding source by March 31 will have 3rd quarter payment of the non-generating funding source held. Once 45% is reached, the program must resubmit the appropriate report for funds from that funding source to be released.
At year-end, if 100% of a fund has not been generated, some funds must be returned to the ICCB.
The types of Enrollment Reports that can be generated include the following:
- 3405 – State Basic
- 3410 – State Public Assistance
- 4800 – Federal Basic
- 4805 – Federal EL/Civics
- 4815 – State Performance
- 4900 – Unrestricted
- 4910 – Other Restricted
Students Included in the Enrollment Report
Students are included in an Enrollment Report based on the following:
- In Open-Entry Classes, have accrued at least 7.5 attendance hours in a class, prior to dropping.
- In Fixed-Entry classes, have been successfully retained through the mid-term date and have accrued at least 7.5 attendance hours in that class, prior to dropping.
- Must be free from all Errors identified via the DAISI Error Check.
All information included in the Enrollment Report is specific to the funding source selected to generate the Enrollment Report. For example, if 3405 – State Basic is generated, only the students and units of instruction associated with that funding source are included in that Enrollment Report. However, since students can be funded with different funding sources in different classes, the Enrollment Reports offers a duplicated student headcount. In other words, if a student is in ESL funded by 3405 – State Basic and in ESL funded by 4800 – Federal Basic, he counts once in each report, and the units from each class are divided between the reports accordingly.
In each Enrollment Report, a student is counted as follows:
- The student is counted only once if all types of instruction are of one instructional type. In other words, in a student takes 3 ESL classes, all funded by 4800, the student will be counted once in the 4800 report and the units from all 3 classes will be included under ESL.
- However, if the student is enrolled in more than one type of instruction (i.e. ESL and ABE), both funded by 4800, the student counts once in each column – ESL Instruction and Adult Basic Education. The units are then divided between the categories accordingly.
ICCB hard-codes the generation amounts into the system each year. The amounts calculated for the Enrollment Reports are based upon these generation rates (The generation amounts can be found in the DAISI system under the Funding Tab and in Fiscal Year Funding). The rates listed in that area determine the amount of money to be ‘generated’ for each unit of instruction by each instructional type. All ESL instruction generates at the ABE rate and all High School Credit Instruction generates at the ASE rate.
The funding requirement amount for the program is entered by the program and recorded in the Fiscal Year Funding area. It is extremely important to make sure these numbers are accurate. State Basic*, State Public Assistance, Federal Basic and Federal EL/Civics require that a minimum of 45% of the budget be expended on instruction. In short, a minimum of 45% of the total amount received for each of these funding sources should be recorded in the Fiscal Year Funding area to ensure the Enrollment Reports calculate correctly.
*Note: The FY22 instruction requirement has been reduced to 25%. Please refer to the most up-to-date information from the Senior Director for Adult Education and Literacy for more information.
Program Status Report
The Program Status Report is a six page report due from programs on a quarterly basis. Because the report includes all students eligible to be served through AEFL funds, it is the most inclusive of the required ICCB reports and provides demographic and testing data that can be used to foster continuous program improvement.
There are three options available to users when producing the report. ICCB-Restricted refers to the required ICCB report, which is described within this document. Unrestricted/Other Restricted produces a report including only those students funded by Unrestricted/Other Restricted dollars, and All Funds produces a report including those students funded by any source (Restricted or Unrestricted/Other Restricted).
Students Included in the Program Status Report
- In Open-Entry Classes, have accrued at least 7.5 attendance hours in a class, prior to dropping.
- In Fixed-Entry classes, have been successfully retained through the mid-term date and have accrued at least 7.5 attendance hours in that class, prior to dropping.
- The hours described above must have taken place within a class funded by Restricted AEFL dollars in order for the student to be included in the required ICCB report. An aggregate report will be produced including students funded by:
- 3405 – State Basic
- 3410 – State Public Assistance
- 4800 – Federal Basic
- 4805 – Federal EL/Civics
- 4815 – State Performance
- For those attending multiple classes, some funded by Restricted and others by Unrestricted/Other Restricted funds, only the attendance hours, enrollment hours, and units of instruction connected to Restricted funds will be included here.
- Those enrolled in Foreign Language GED and Vocational classes (where testing is not required) are included here.
- To be included, students must be free from all Errors identified via the DAISI Error Check.
Report Breakdown
Student counts by Instructional Category (Unduplicated):
This table produces an unduplicated student count. Each student is counted only once, even if they attended more than one class during the fiscal year or received different types of instruction in different classes (i.e. ABE and ESL).
The Instructional Category into which each student is placed is determined by the Instructional Category selected when assigning each student to a class. If a student attends more than one class, with differing types of instruction (i.e. ABE and ESL), he/she is placed into the category containing the greater number of attendance hours. In this situation, all of the hours (attendance hours, enrollment hours, and units of instruction) connected to a student move along with them to the one category in which they are classified.
For example let’s say a student attends both an ABE and ESL class during the fiscal year. Because more attendance hours took place in the ESL class, they are assigned to the ESL category. The hours from both classes are included within the ESL category, even though a portion of those hours took place in an ABE class. The hours move along with the student.
The following terms appear on the report, and are defined as follows:
- # of Students: Total unduplicated number of students served
- # Pre-tested: Total number of these students who received a pre-test
- # Post-tested: Total number of these students who received a post-test
- Post-Test Rate: # Post-tested divided by # Pre-tested times 100. Please note that this is not the overall PostTest Rate used in determining the program’s performance toward meeting the state established post-test rate target. For that purpose, the post-test rate is calculated using the bank of students included in the NRS Performance Report.
- Attendance Hours: Total hours attended by the total number of students.
- Enrollment Hours: Total enrollment hours generated by the total number of students.
- Units of Instruction: Total units of instruction generated by the total number of students.
Student Counts by Instructional Categories (Duplicated)
This table produces a duplicated student count. Each student is counted once in each Instructional Category attended. If the student attended more than one class during the fiscal year, but all classes were of one Instructional Category (i.e. ESL), the student would be counted only once (not once for each ESL class attended) in the ESL category. However, if the student attended more than one class, and the classes were of different Instructional Categories (i.e. ESL and ABE), the student would be counted once in each category.
In this table, attendance hours, enrollment hours, and units of instruction again follow the student. Example: Student attends both an ABE and ESL class during the fiscal year. Student is counted once on the ABE line and once on the ESL line. Hours taking place within ABE classes appear on the ABE line, and hours spent in ESL classes appear on the ESL line.
The column definitions are otherwise identical to those in the Unduplicated table.
Note: The total number of students served will be higher in the Duplicated table for those programs who serve students dually enrolled in multiple Instructional Categories within one fiscal year. However, the total hours will remain identical between the two tables. It is only the distribution of these hours within the tables that will differ.
Student Counts by Instructional Category
This table presents data for students enrolled in Foreign Language GED, Math Only, and Citizenship courses. The counts are a sub-set of the numbers used in the previous tables. Foreign Language GED students may have been included in the ASE category, Math Only in ABE or ASE, and Citizenship in ABE, ASE, or ESL.
To be included here, the student must have attended 7.5 hours in an open-entry class or have been enrolled through the mid-term date and have attended 7.5 hours in a fixed entry class under one of these course types. The counts are unduplicated within each type. Example: One student attends two different Foreign Language GED classes. Student is counted once on the Foreign GED line, although the hours from both classes are included here.
The report will include the following measures, which are defined as follows:
- # of Students: Total unduplicated number of students served in each type of course.
- Attendance Hours: Total hours attended by the total number of students.
- Enrollment Hours: Total enrollment hours generated by the total number of students.
- Units of Instruction: Total units of instruction generated by the total number of students.
Demographic Breakdown by Instructional Category
This table produces an unduplicated student count, presenting ethnicity, age, and gender data by Instructional Category. Students are assigned to Instructional Categories using the same methodology described in connection to the Unduplicated table on Page 1. The total number served should be identical between these two tables.
Status
This table produces an unduplicated student count, presenting status data by Instructional Category. Students are assigned to Instructional Categories using the same methodology described in connection to the Unduplicated table on Page 1.
One student may be counted in more than one line, if the applicable status applies to the student. For example, let’s say an ESL student is employed full-time and lives in an urban area. The student will be counted in both the Employed Full-Time and Urban areas under ESL. Unduplicated refers to a student appearing under only one Instructional Category per line. The majority of the Status items are recorded on each student’s Status tab, while some are recorded on the Bio/Demo tab. Please see the Students: Add Students section of this guide for Status screen item definitions.
Self-Reported Achievements/Completions
This table presents self-reported student achievement data and is a sub-set of the Unduplicated table on Page 1. Please note that the ICCB uses self-reported High School Diploma, U.S. Citizenship, and Completed Vocational Program achievements for Performance funding and NRS reporting purposes. However, statewide data matching is used to identify students who passed the GED. Performance funding and NRS data are based upon the GED counts resulting from the data matching process.
The report will include the following measures, which are defined as follows:
- Total GED: Total number of students with a self-reported GED Pass date occurring within the fiscal year – includes both English and Foreign Language GED’s, as recorded in the Testing area. Students who took the GED test but did not pass are excluded, as are students who passed but took the test in a different fiscal year.
- Foreign Language GED: This is a sub-set of the Total GED count. Students are counted here if they had a self-reported Foreign Language GED Pass date occurring within the fiscal year, as recorded in the Testing area. Again, students who took a Foreign Language GED test but did not pass are excluded, as are students who passed but took the test in a different fiscal year.
- High School Diploma: Total number of students who received a high school diploma within the fiscal year, as recorded in the Achievement area.
- U.S. Citizenship: Total number of students who passed the United States Citizenship exam within the fiscal year, as recorded in the Achievement area.
- Completed Vocational Program: Total number of students who completed a vocational program within the fiscal year, as recorded in the Achievement area.
Testing Information by Instructional Category and Test Type:
These tables present student testing data by Instructional Category. Students are placed into Instructional Categories based upon the Instructional Category selected when assigning the student to a class.
Within the ABE, ASE, HSCR, and Vocational Instructional Categories, the table presents an unduplicated student count. If a student is dually enrolled in any combination of these within the fiscal year, the student is placed into the category containing the larger number of attendance hours. Hours from all classes (from each category) between pre- and post-test dates appear in the one category to which the student is assigned. The hours follow the student.
For example, let’s say a student attends an ABE and VOC class and is given a TABE-Reading. More attendance hours took place in the ABE class, so the student is assigned to the ABE category. Attendance hours from both the ABE and VOC class which took place between the pre- and post-test dates appear in the ABE category.
Students dually enrolled in ESL and any other category (ABE, ASE, HSCR, or VOC) within the fiscal year appear in both the ESL category and in the other category attended. The attendance hours between pre- and post-test for a student divide accordingly.
For instance, let’s say a student attends an ESL class and is given a CASAS test and attends an ABE class and is given a TABE-Reading. The student is counted in the ESL CASAS table and the ABE TABE table. The attendance hours in between pre- and post-test dates in the CASAS table include hours connected to ESL instruction. The hours in between pre- and post-test dates in the TABE table include hours connected to ABE instruction.
Students enrolled only in ESL instruction may be administered more than one ESL testing series during the fiscal year. An ESL student with two ESL assessments will be counted in both ESL testing tables. The attendance hours between pre- and post-test dates reflect the attendance hours earned in ESL instruction.
To illustrate this point, let’s say a student is given a BEST-Literacy pre and a CASAS pre. Post-testing for the CASAS occurs after 40 hours of attendance and after 60 hours of attendance for the BEST Literacy. The student will be counted in the CASAS area (with 40 hours used between pre and post) and counted in the BEST Literacy area (with 60 hours between pre- and post).
The following measures are included in the report and are defined as follows:
- Pre-Tested: Number of students who received a pre-test.
- Post-Tested: Number of these students who were post-tested at least once. If multiple post-tests (of one Test Type) are entered for one student, the final post-test is automatically counted as the post-test within DAISi.
- Hours between Tests: Total attendance hours occurring between pre and post-test date.
- Students Gained a Level: Number of post-tested students who advanced at least one NRS level.
- Students Gained 2+ Levels: Number of post-tested students who advanced two or more NRS levels.
- Students with Point Gains: Number of post-tested students who improved their score by at least one point. Students do not have to have advanced an NRS level to be included here, provided they experienced any type of score increase.
- Average Points Gained: Average number of points gained for students who experienced any type of point increase. Total number of points gained (by students included in Students with Point Gains column), divided by Students with Point Gains = Average Points Gained.
- Number of students with more than one ESL testing series: Total number of ESL students who had more than one ESL Test Type administered during the fiscal year (i.e. BEST-Literacy and CASAS). This is helpful in identifying how many students are duplicated within the ESL testing table.
- Number of students dually enrolled in ESL and ABE, ASE, HSCR, or VOC: Total number of students enrolled in ESL and any of the other Instructional Categories during the fiscal year, provided a TABE test was entered in connection with the other Instructional Category. This count is helpful in identifying how many students are duplicated between the TABE and ESL testing tables.
Class Detail Information:
The first table lists the total number of classes offered during the fiscal year by Enrollment Type. Summer classes are counted in the reporting year to which they are assigned by the user. The GED Illinois table is a sub-set of the first table. All classes are counted in the first table, and those that use GED Illinois in any way are then counted in the second table, as well. Please see the Classes section of this guide for definitions on the various Enrollment Types.
The following measures are included in the report and are defined as follows:
# of Classes: Total number of classes offered during the fiscal year by Enrollment Type.
# of Students: Total number of students who were counted as “enrolled” in each type of class. In Open Entry and Individualized Instruction Classes, students must have accrued at least 7.5 attendance hours, prior to dropping. In Fixed-Entry Classes, students must have been successfully retained through the mid-term date and have accrued at least 7.5 attendance hours, prior to dropping. The table presents a duplicated count – students are counted once for each class attended during the fiscal year.
NRS Performance Report
A key feature of this report is that it includes information about Measurable Skill Gains by Education Functioning Level. Measurable Skill Gains are defined as an NRS level gain, attainment of a high school diploma or its recognized equivalent.
This report also contains references to Periods of Participation. A Period of Participation begins on the first day a student attends class at a program and ends on the last day a student attends class before 90 days of inactivity. Therefore, the end of a period of participation is not defined until 90 days elapse without any attendance from the student.
In order to be included in this report, students must have a minimum of 12 hours (see information below for more details), be appropriately pre-tested, and be error free within the DAISI system.
There are three options available to users when producing the report. All Funds refers to the required ICCB report, which is described within this document. The ICCB-Restricted Funds option produces a report that includes students funded by grant funds only. The Unrestricted/Other Restricted produces a report including only those students funded by Unrestricted/Other Restricted dollars.
Students Included in the NRS Report
In Open-Entry Classes, the student has accrued at least 12 total attendance hours in classes.
These hours do not have to occur within one class. For example, 7.5 hours in one class starts the ‘clock’ for a student. They are then included in other reports, but are not included here. To be included here, the student would either need to attend a full 12 hours in that class or they might enroll in a second class and attend the 7.5 hour minimum. The 7.5 hours from two classes would add up to 15 hours, which would render them ‘countable’ in this report. Note that if the student attended one class and attended 7.5 hours and then a second class for 4.5 hours, although this adds up to 12, they would not be counted, as the ‘clock’ does not start in any one class until they accumulate 7.5 hours.
In Fixed-Entry classes, the student has been successfully retained through the mid-term date and has accrued at least 12 attendance hours in that class, prior to dropping.
Students are included in this report regardless of their funding source.
Those enrolled exclusively in Foreign Language GED and Vocational classes are excluded from this report. If a student attended both an eligible class and a VOC or Foreign Language GED class, the hours associated with the Vocational or Foreign GED class are omitted.
Must be free from all Errors identified via the DAISI Error Check.
Students with a pre-test score of ESL Exit Criteria are excluded from this report unless they are also administered an ABE/ASE test and enrolled in ABE/ASE/HSCR classes.
All tables provide an unduplicated student count. HSCR students are not listed out separately in this report but are included. They are placed in the appropriate ABE or ASE level, based upon their TABE pre-test score.
Students are placed in tables based on the following criteria:
The tables present an unduplicated student count. If a student attended more than one class (over 7.5 hours attended in each in order to count that class), and each had a different instructional type, the following criteria would be used in placing the student. This functions differently than within the Program Status Report, where the placement would be determined based on the area containing the larger number of attendance hours. Remember that a student must have a minimum of 12 attendance hours to be included in this report. Each student is unduplicated in this report.
If enrolled in a Vocational or a Foreign GED class and something claimable, the student is included in the claimable area and any hours associated with the VOC or Foreign GED class are excluded. The student would be counted in the NRS level that corresponds with their placement based on the pre-test of the other claimable area. If the student only attended a Vocational or Foreign GED class, they are excluded entirely.
If dually enrolled in ABE and ASE instruction, the student is placed in the category represented by their pretest level as indicated by the TABE. For ABE and ASE enrollments, the required assessment is the TABE-R or CASAS-R (unless the course has a Math-Only designation in which the required assessment becomes the TABE-M or CASAS-M). For ABE and ASE enrollments that are not Math-Only students can also be administered a TABE-M if the program elects to do so. This would most often be done when the student is in a General Skills course with an emphasis being spent on math instruction. If both TABE-R and TABE-M or CASAS-R and CASAS-M have been administered, the student’s placement would be based on the following:
- The assessment showing the lowest Educational Functioning Level (EFL)
- If both assessment show the same EFL, placement would be based on the assessment with the lowest scale score
- If both EFLs are the same and both scale scores are the same, the placement would be based on the first assessment given.
- Attendance hours from both ABE and ASE instruction would be recorded in that NRS Level.
If a student has more than one period of participation, and they make a level gain in both periods of participation, level gains are added together and negative level gains are zeroed.
If the student is enrolled in a Math Only class and nothing else, the student will be placed in the instructional category associated with the student’s pre-test score on the TABE-M. However, if the student is dually enrolled in a Math-Only class (as ABE or ASE) and any other type of instruction (ESL or ABE/ASE), the student is assigned to a category based on the assessment showing the lowest EFL.
If the student receives ESL services, placement is based on the ESL assessment administered. If multiple ESL assessments are given (programs can elect to give two different ESL assessments during a FY if needed), placement will be based and progress measured based on the pre-test of the assessment that reflects the lowest EFL. If both ESL pre-test assessments reflect the same EFL, the one with the earliest date would be used. Note there is an exception in a case where the student has two assessments that both reflect a pre-test level at ESL Advanced if one of those assessments is the BEST Literacy. Since students can’t test outside the Advanced range on the BEST Literacy, the placement (and follow-up progress) would be measured based on the other assessment reflecting the ESL Advanced level.
If dually enrolled in ESL and either ABE or ASE the student is assigned to an NRS category based on the assessment that reflects the student’s lowest EFL. When determining the lower EFL, ESL is classified as a lower level than ABE or ASE levels so the student will be placed based on the ESL assessment. There are two exceptions to this that are as follows:
- If the student’s only ESL assessment was BEST Literacy and the pre-test level for that assessment reflected the ESL Advanced level, placement would be based on ABE/ASE testing. This is because a level gain at that level isn’t possible.
- If the ESL assessment pre-test(s) placed the student in the ESL Exit Criteria range, the student’s placement would again be based on the ABE/ASE instruction and the results of the TABE testing.
The attendance hours connected to a dually enrolled student move along with them to one category. In other words, if a student was both in an ASE and an ESL class, and ended up classified as ESL after considering the above criteria, all attendance hours, both those in ESL and those in ASE, would count in ESL. The hours follow the student.
Based on the above criteria for placement of students, the information outlined below explains each table in the report.
Table #1: Participants by Entering Educational Level, Ethnicity, and Sex
This table outlines the various NRS levels and places students in these levels by ethnicity and gender.
Table #2: Participants by Age, Ethnicity and Sex
This table outlines various age ranges and categorizes students by ethnicity and gender in those age ranges.
Table #2a: Ineligible Participants by Age, Ethnicity, and Sex
This table is structured in the same format as Table #2, but contains students that did not meet the requirements necessary to appear on an NRS Report (12 or more Attendance Hours, error-free, etc.).
Table #3: Participants by Program Type and Age
This table categorizes students by age and educational functioning level (within the instructional types).
Table #3 IETP: IET Participants by Program Type and Age
This table is identical to Table #3 in format, but contains only students flagged as IET students in DAISI. The students included in this table are a subset of those in Table #3.
Table #4: Educational Gains and Attendance by Educational Functioning Level
Explanation of columns:
- Column A – Entering Educational Functioning Level: Level student is placed in based on pre-test score
- Column B – Total Number Enrolled: Total number of students (those with 12 attendance hours, as described earlier)
- Column D – Total Attendance Hours: Total number of attendance hours connected to students in column B
- Column E – Number Completed Level: This column indicates that a level completion has occurred if both of the following criteria is met:
- The student moved into a higher NRS level based on a level gain (NRS level gain based on EFLs) from pre to post test.
- The student did not obtain a high school diploma or its recognized equivalent.
- Column F – Number who obtained a high school diploma or its recognized equivalent
- Column G – Number Separated Before Achieving Measurable Skill Gains: Number of students who separated from the program before achieving a measurable skill gain as defined as an NRS level gain, attainment of a high school diploma or its recognized equivalent
- Column H – Number remaining in Program without Measurable Skill Gain: Number of students still enrolled (not separated) who never achieved a measurable skill gain as defined as an NRS level gain, attainment of a high school diploma or its recognized equivalent
- Column I – Percentage Completing Level: Columns (E+F)/Column B
Table #4a: Educational Functioning Level Gain
Explanation of Columns:
- Column A – Entering Educational Functioning Level: Level student is placed in based on pre-test score.
- Column B – Total Number Enrolled: Total number of students (those with 12 attendance hours, as described earlier).
- Column C – Number with EFL Gain for ELA/Literacy or ELP by pre-/post-testing: Total number of students who achieved a level gain on an OCTAE-approved Literacy or ESL assessment. These assessments include: TABE-R, CASAS-R, CASAS, BEST-Literacy, and BEST-Plus.
- Column D – Percentage Achieving ELA/Literacy or ELP EFL Gains: Column C divided by Column B
- Column E – Number with EFL Gain for Mathematics by pre-/post-testing: Total number of students who achieved a level gain on OCTAE-approved Mathematics assessment. These assessments include TABE-M and CASAS-M.
- Column F – Percentage Achieving Mathematics EFL Gains: Column E divided by Column B
Table #4b: Educational Gains and Attendance for Pre- and Post-tested Participants
This table is identical in format to Table #4. However, Table #4 reflects results for all students included in this report while Table #4b only includes individuals who were pre and post-tested (or ASE High students who were granted a level gain based on reasons outlined above) and excludes those who did not receive a post-test. The following is an explanation of columns:
- Entering Educational Functioning Level: Level student is placed in based on pre-test score.
- Total Number Enrolled Pre- and Post-tested: Total number of students (those with 12 attendance hours who have both a pre and post test)
- Total Attendance Hours: Total number of attendance hours connected to students in column B.
- Number Completed Level: This column indicates that a level completion has occurred if any one of the following criteria is met.
- The student moved into a higher NRS level based on a level gain (NRS level gain based on EFLs) from pre- to post-test.
- Obtained a high school diploma or its recognized equivalent.
- Number who Completed a Level and Advanced One or More Levels: This is a sub-set of the previous column, and includes the following students for whom at least one of the following is true:
- The student moved into a higher NRS level based on a level gain as described previously and obtained a high school diploma or its recognized equivalent
- The student post-tested two or more NRS levels higher than their pre-test level
- The student achieved an NRS level gain in more than one period of participation
- Column F – Number Separated Before Completed: Number of students separated from the program who post-tested but did not advance a level
- Column G – Number remaining within Entry Level: Number of students still enrolled (not separated) who post-tested but did not advance a level.
- Column H – Percentage Completing Level: Number completed level divided by Total Number Enrolled.
Table #4c: Contains Participants who are Distance Learners and have at least 12 attendance hours
- Columns A-I are the same as those in Table #4
- Column J: Number of periods of participation (as defined in the second paragraph of this section) in which the student earned a measurable skill gain as defined as an NRS level gain, attainment of a high school diploma or its recognized equivalent.
- Column K: Number of periods of participation with Measurable Skill Gains (Column J) divided by Total Number of Periods of Participation (Column I)
Table #6: Participant Status and Program Enrollment
The information for this table is pulled from the Student Status screen area.
- Column A – Participant Status and Program Enrollment: This column lists the data collected on the student status screen
- Program Type and Institutional Programs are pulled from the “Enrolled In:” area on the status screen.
- Column B – Number of Participants: This column lists the number of students who have the item “checked” or indicated on the Student Status Screen.
Please note the following:
- #3 Employed will include both students who are employed Part or Full-Time
- #6 Public Assistance includes all students who are marked as “Yes” in response to the “On Public Assistance” field. This column is not tied to the Public Aid Funding Source.
The table also provides information on the highest degree of school completed. These numbers are further broken down by US Based Schooling and Non-US Based Schooling. Information on the number of students enrolled in various program types (i.e. Family Literacy, Workplace Literacy, Program for the Homeless and Program for Work-based Project Learning) is provided.
The table also provides information about students served in Institutional Programs such as Correctional Programs and Community Correctional Program.
Secondary Status numbers (i.e. Low income, Displaced Homemaker, Single Parent, Dislocated Worker and Learning Disabled Adults) are provided.
Table #7: Adult Education Personnel
The information is pulled from two sources and consists of the following columns:
- Column A – Function: This column explains the function of the staff person.
- Column B – Total Number of Part-Time Personnel: This column indicates the number of part-time personnel by function.
- Column C – Total Number of Full-time Personnel: This column indicates the number of full-time personnel by function.
- The next column totals the numbers from Columns B and C by function.
- Column D – Unpaid Volunteers: This column indicates the number of full-time personnel by function.
Please note the following:
- Information for Administrative, Counselor and Paraprofessional Personnel will be collected based on the data entered into the Adult Education Personnel table (Table 7) outlined in the quarterly reporting instructions.
- This table also identifies the Teacher’s Years of Experience in Adult Education and the various levels of Teacher Certification.
NRS Goal Table – Primary Goals
These tables show how many students at each level chose a particular goal as a primary goal. The key at the bottom defines the numerical column headings. In addition, under each goal number, the following information appears:
- Set: This column represents the number of students who set the specific goal by goal number and by NRS level.
- Ach: This column represents the number of students who achieved this particular goal.
- Total: This column represents the total number of goals set and achieved by NRS level.
NRS Goal Table – Secondary Goals
These tables show how many students at each level chose particular goals as a secondary goal (if applicable). The key at the bottom defines the numerical column headings. The same information regarding the number of goals set and achieved are included here as well as the totals for secondary goals.
Testing Data
This table outlines the number of students pre and post-tested, regardless of whether a gain occurred or not. The table only includes students who are NRS eligible. This table breaks out by NRS level the following:
- Pre-Tested: Total number of students pre-tested by NRS level. Student is placed into NRS level based on criteria outlined at the beginning of this document.
- Post-Tested: Total number of students post-tested by NRS level.
- Post-Test Rate: This column provides a post-test rate by NRS level.
- In addition to pre and post-test information by level, the table also provides the total number of students’ pre and post-tested in the program with an overall post-testing percentage.
- Remember that HSCR is not broken out into a separate instructional type within this report – the students are included in the ABE/ASE counts, according to their grade level equivalency.
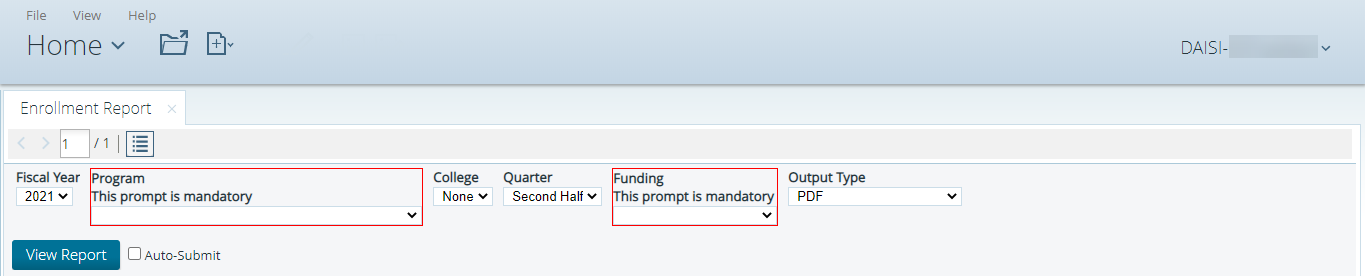
Generating a Report
To generate a report, select the following details from the drop-down menus:
- Fiscal year
- Program Name
- College (if applicable)
- Quarter
- Funding Source
- Output type
Fields that are outlined in red are mandatory. Check the Auto-Submit box to automatically view search results after each field is updated.
When you are finished selecting the appropriate details, click View Report.
NOTE: Generating a report is process intensive and may require some time to complete. Please be patient. The report will display on the screen when it has been completely generated.
Static Reports
Prefer to learn using videos? Check out this recorded training on the Static Reports section of DAISI.
To access the required reports, choose one of the links under the Static heading on the Reports page.
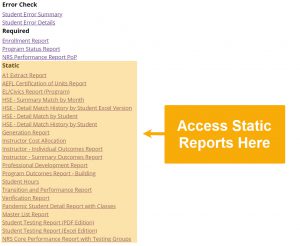
As with other reporting areas within the system, clicking a report link will present a page prompting for additional information. Select the desired information and click View Report to generate the selected report.
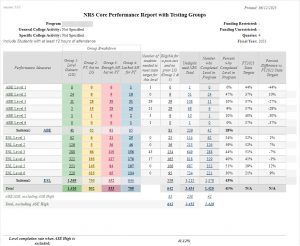
NRS Core Performance Report with Testing Groups
A key feature of this report is that it includes information about Performance Measures and identifying students eligible for a Post-Test by Education Functioning Level. Each student is assigned to one of the following groups based on their current Period of Participation*:
- Group 1: Level Gainers
- Group 2: Post Tested but no Level Gain
- Group 3: Enough Attendance Hours but no post-Test
- Group 4: Lacked Attendance Hours for Post-Test
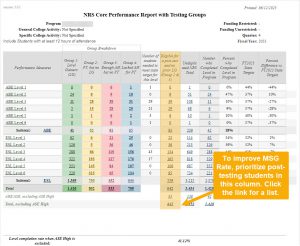
To maximize level gains, ICCB recommends focusing on students in the
Eligible for a post-test and no prior LG (Group 2 & 3) column, which contains a subset of Groups 2 and 3.
This report also contains the following information:
- Number of students needed to meet state target for this level: The number of additional students who need to complete an education functioning level gain to meet the State MSG Target
- Unduplicated NRS Total: The number of students who entered each EFL at the beginning of their current Period of Participation*
- Number who Completed Level in Program: The number of students from each EFL who have completed at least one education functioning level gain
- Percent who Completed Level in Program: The Number who Completed Level in Program divided by the Unduplicated NRS Total
- FY2023 State Targets: The State MSG Target for each Education Functioning Level
- Percent Difference vs. FY2023 State Targets: Percent who Completed Level in Program minus the State FY2023 State Targets
*The NRS Performance Report POP (available in the Required Reports section) assigns students to an Education Functioning Level based on their first Period of Participation, so you may notice small discrepancies between these two reports.
Student included in The NRS Core Performance Report with Testing Groups
In order to be included in this report, students must have a minimum of 12 hours (see information below for more details), be appropriately pre-tested, and be error-free within the DAISI system. In Open-Entry Classes, the student must have accrued at least 12 total attendance hours.
These hours do not have to occur within one class. For example, 7.5 hours in one class starts the ‘clock’ for a student. They are then included in other reports but are not included here. To be included here, the student would either need to attend a full 12 hours in that class or they might enroll in a second class and attend the 7.5 hour minimum. The 7.5 hours from two classes would add up to 15 hours, which would render them ‘countable’ in this report. Note that if the student attended one class and attended 7.5 hours and then a second class for 4.5 hours, although this adds up to 12, they would not be counted, as the ‘clock’ does not start in any one class until they accumulate 7.5 hours.
In Fixed-Entry classes, the student must be successfully retained through the mid-term date and must have accrued at least 12 attendance hours in that class prior to dropping.
Students are included in this report regardless of their funding source.
Those enrolled exclusively in Foreign Language GED and Vocational classes are excluded from this report. If a student attended both an eligible class and a VOC or Foreign Language GED class, the hours associated with the Vocational or Foreign GED class are omitted.
Must be free from all Errors identified via the DAISI Error Check.
Students with a pre-test score of ESL Exit Criteria are excluded from this report unless they are also administered an ABE/ASE test and enrolled in ABE/ASE/HSCR classes.
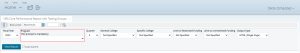
Generating a Report
To generate a report, select the following details from the drop-down menus:
- Fiscal year
- Program Name
- College (if applicable)
- Quarter (select Quarter 4 to view real-time data)
- Output type (select HTML to view a report with clickable links)
Fields that are outlined in red are mandatory. Check the Auto-Submit box to automatically view search results after each field is updated.
When you are finished selecting the appropriate details, click View Report.
NOTE: Generating a report may require some time to complete. Please be patient. The report will display on the screen when it has been completely generated.
Ad Hoc Reports
Create a New Ad Hoc Report
Prefer to learn using videos? Check out this recorded training to learn how to produce an Ad Hoc Report.
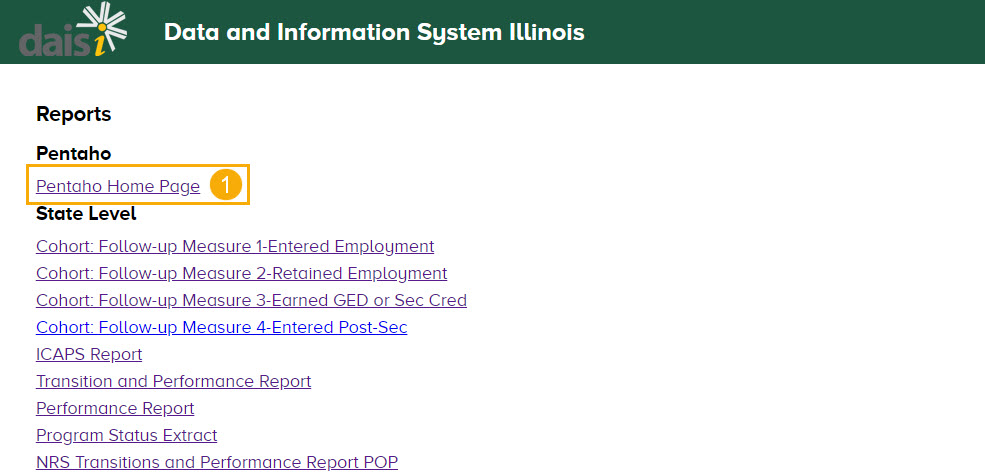
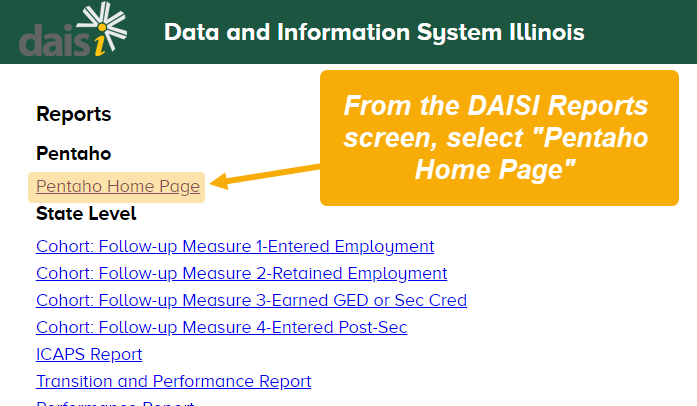
To start an Ad Hoc Report, click the “Pentaho Home Page” link at the top of the reports page.
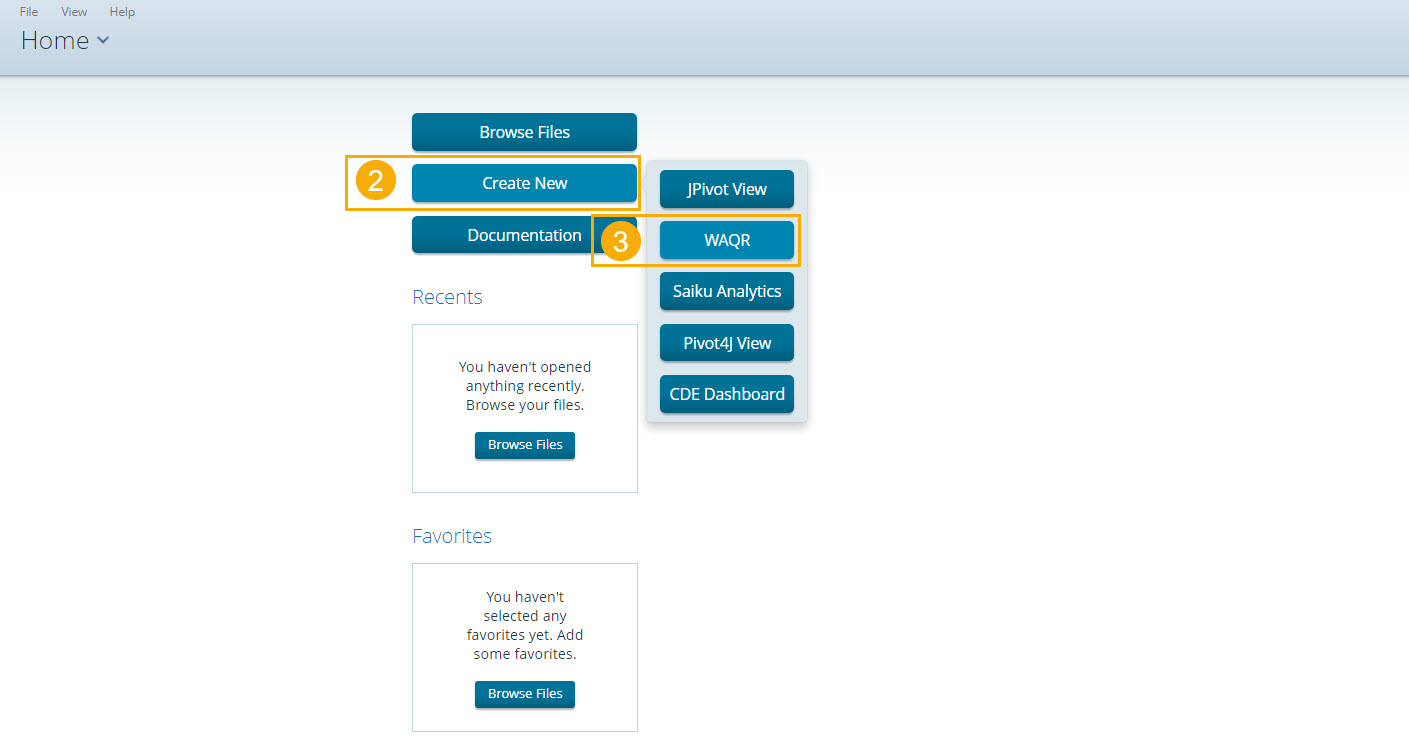
Then, select “Create New,” and “WAQR.”
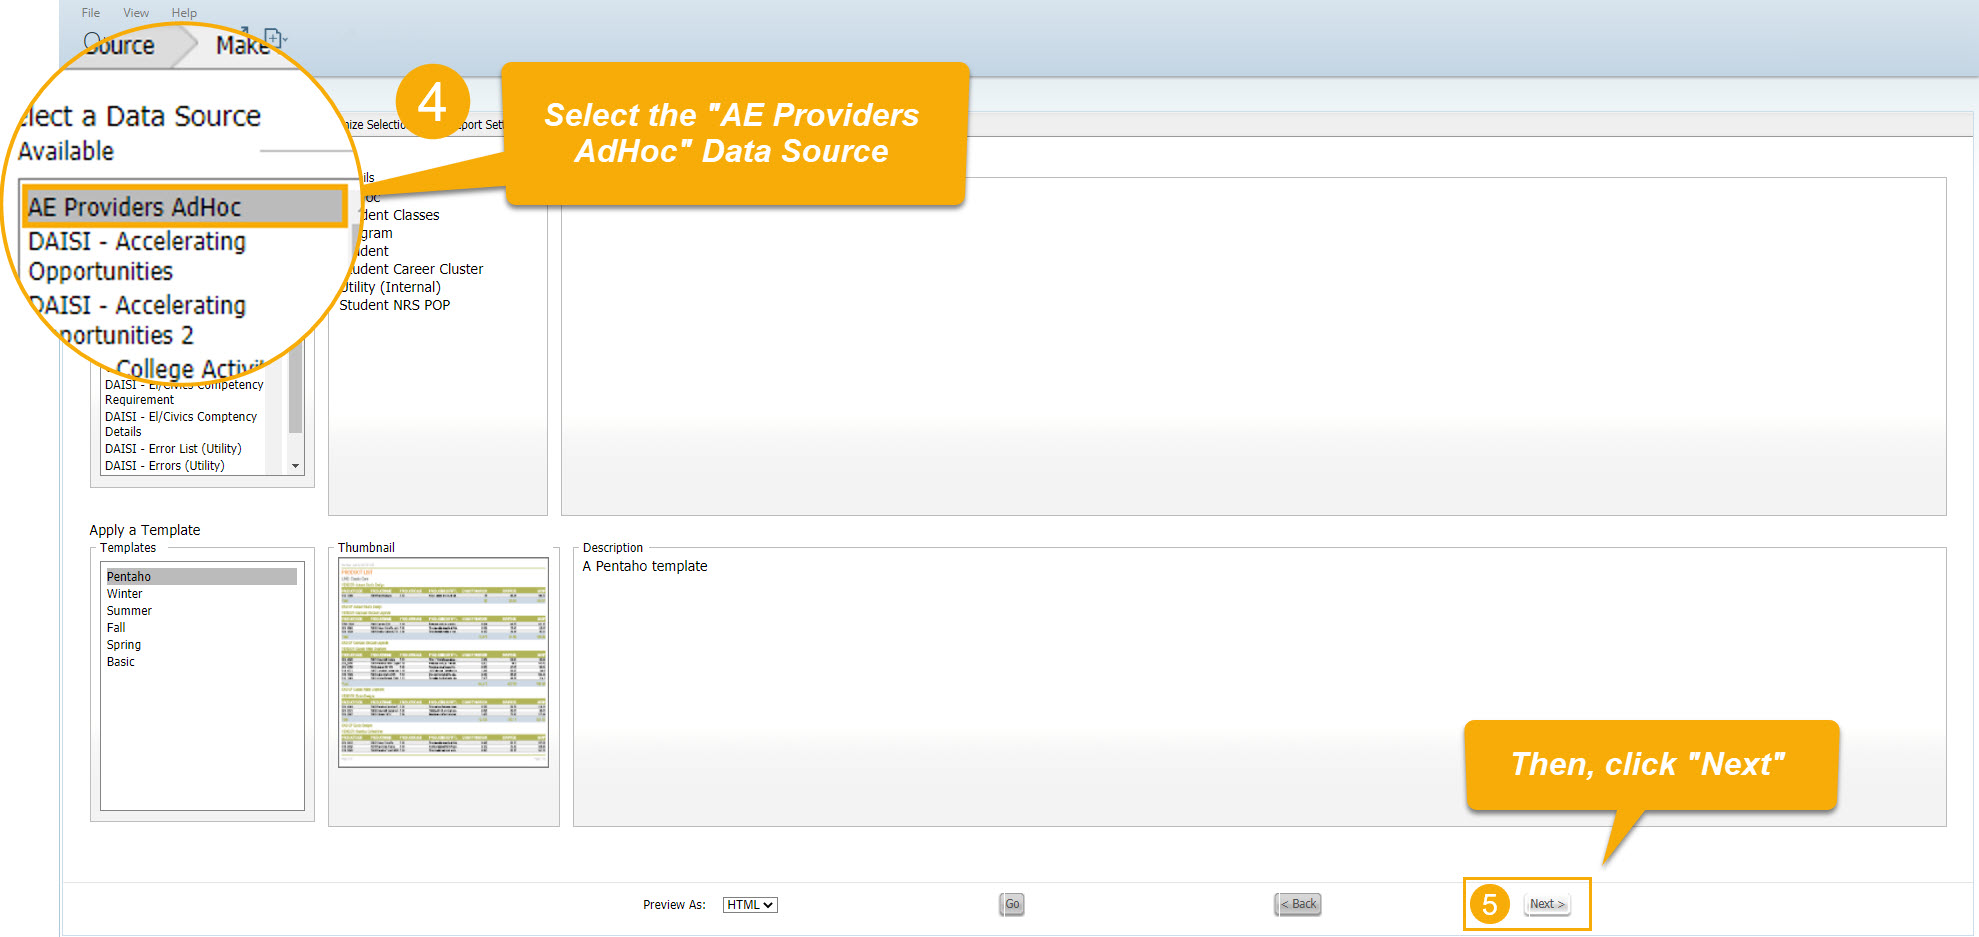
In the “Select a Data Source” area, select the “AE Providers AdHoc” data source. It should be selected by default. Then, click the “Next” button at the bottom-right of the screen.
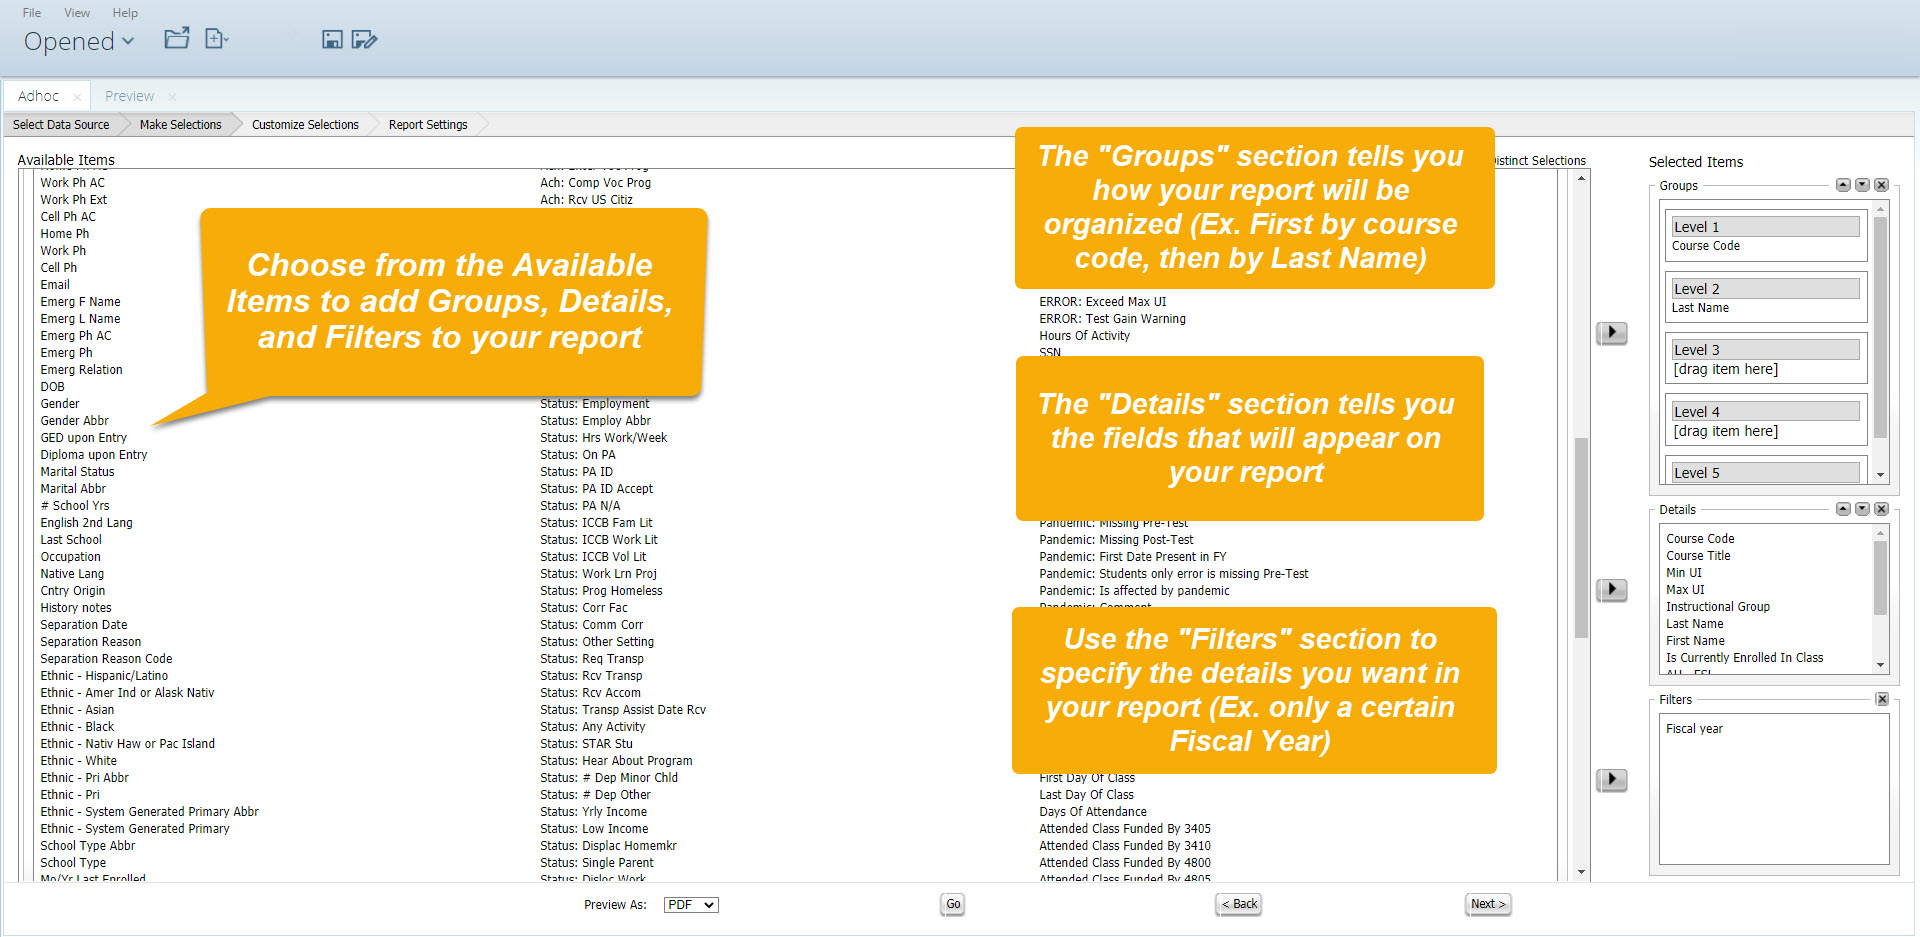
Choose from the Available Items to build your report. To break your report into certain sections, drag an Item into the “Groups” section. To add data into your report, drag an Item into the “Details” section. To use an Item to filter your results, drag it into the “Filters” section.
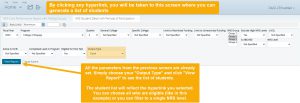
Click Next. On the “Customize Selections” page, specify and activate the filters you chose. Click on the name of the filter in the “Filters” section at the bottom-left of the screen, and click the “Add a Constraint” button. Choose an option from the drop-down menu to specify how you’d like the filter to work, and enter a criteria into the box. Check the checkbox to the right to activate the filter, and click “Next” to move onto the final step.
See the following GIF for a short demonstration of how to specify and activate a filter:
To delete a filter, check the checkbox, and click on the small gray “X” to the right of the “Add a Constraint” box.
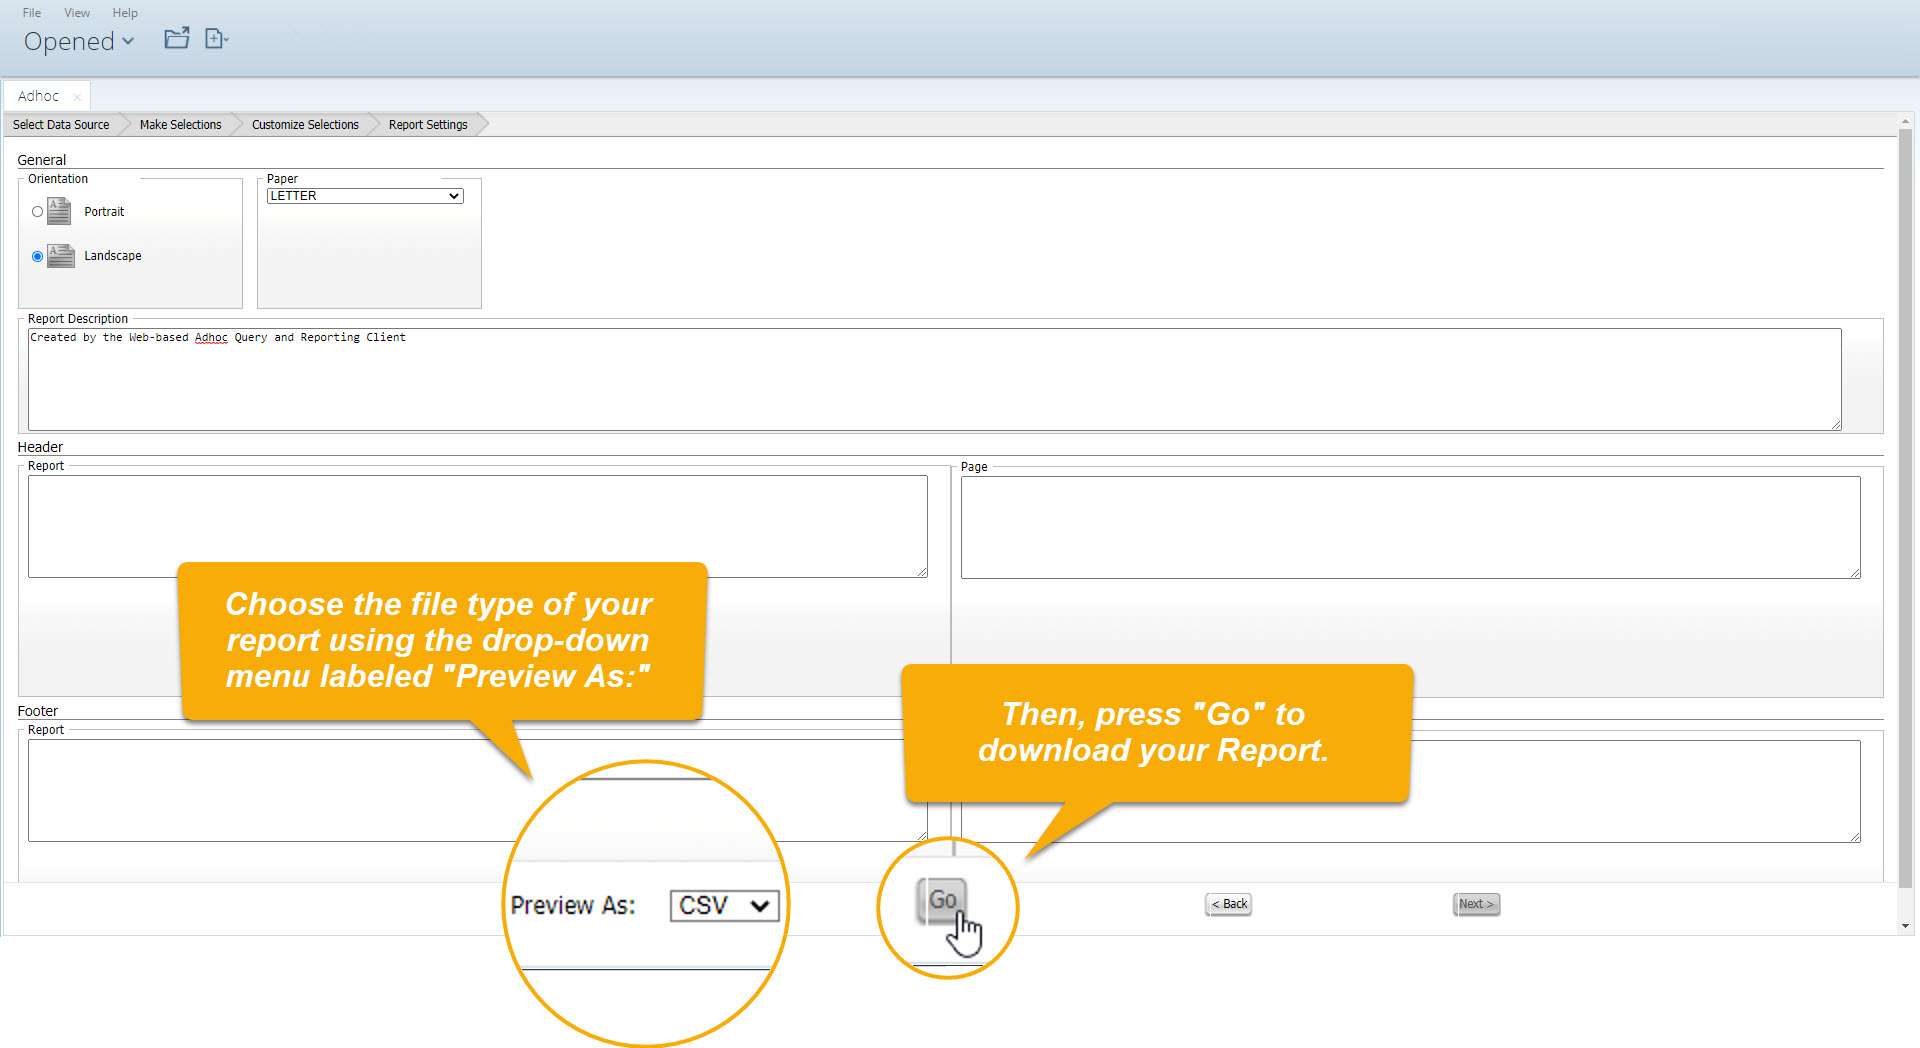
Finally, use the drop-down menu labeled “Preview As” at the bottom of the page to specify the file type of your report. Then, press “Go” to download the Report from your browser.
Schedule an Existing Ad Hoc Report
On the DAISI Reports page, select the first link; “Pentaho Home Page”.
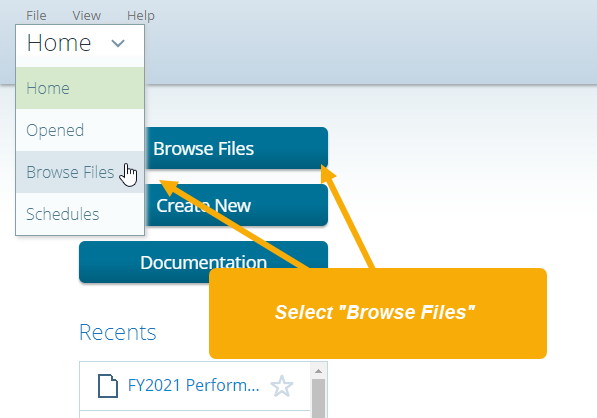
Using either the blue button or the drop-down menu in the top left corner of the screen, select “Browse Files”.
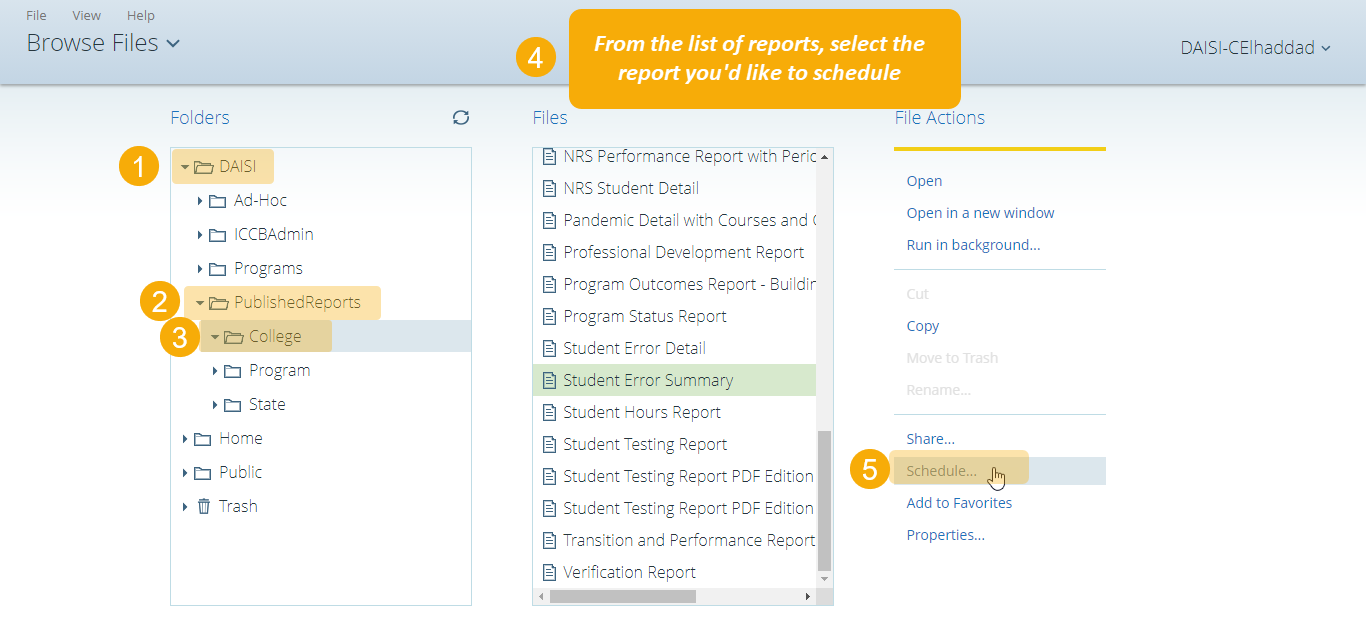
Select the following folders in consecutive order:
- DAISI
- PublishedReports
- College
In the center of the screen, a list of all reports in DAISI will appear in the “Files” pane. Select the report you’d like to schedule. Then, click the “schedule” link on the right side of the “Files” pane.
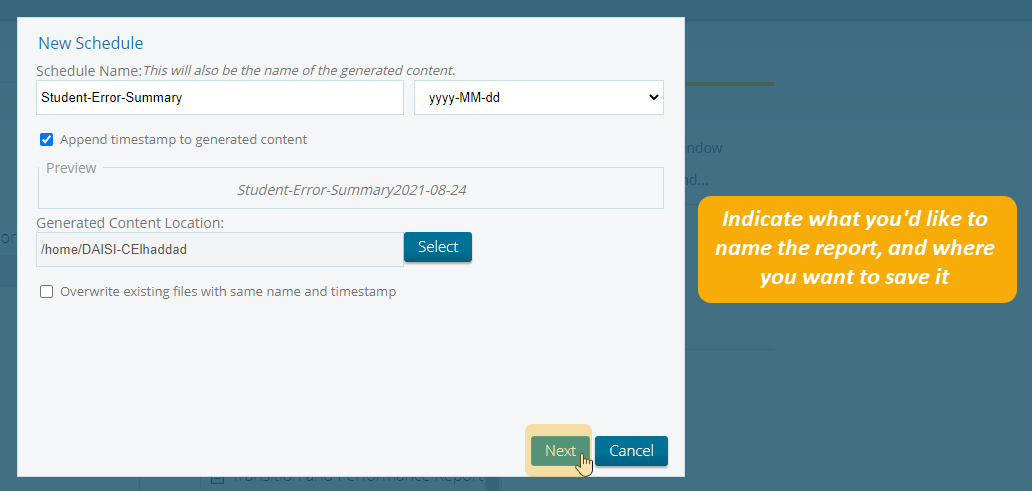
A pop-up window will appear to help you customize your schedule. First, name your report. If you’d like the name to include the date on which the report was generated, click “Append timestamp to generated content.” In the “Generated Content Location” field, select the location in Pentaho in which you’d like the report to be saved. Click “Next” when you’re finished.
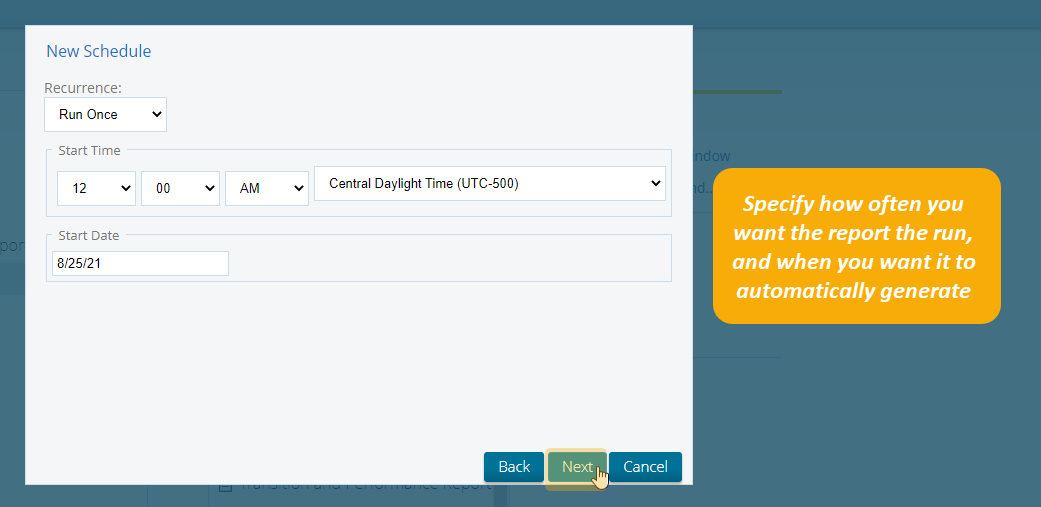
Next, use the fields shown to customize the date on which the report will generate, how often it will generate, and the duration of your schedule. Click “Next” when you’re finished.
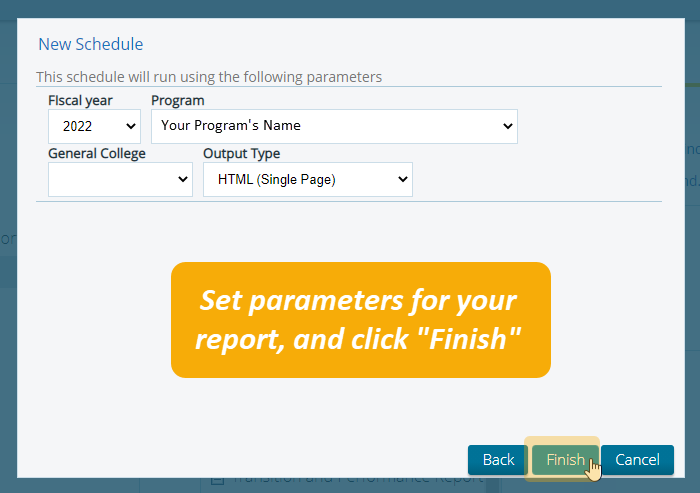
Finally, set parameters for your report. For example, if you want your report to include data from FY2022 and to be downloaded in PDF form, specify those details on this screen. When you’re satisfied with the report settings, click “Finish”.
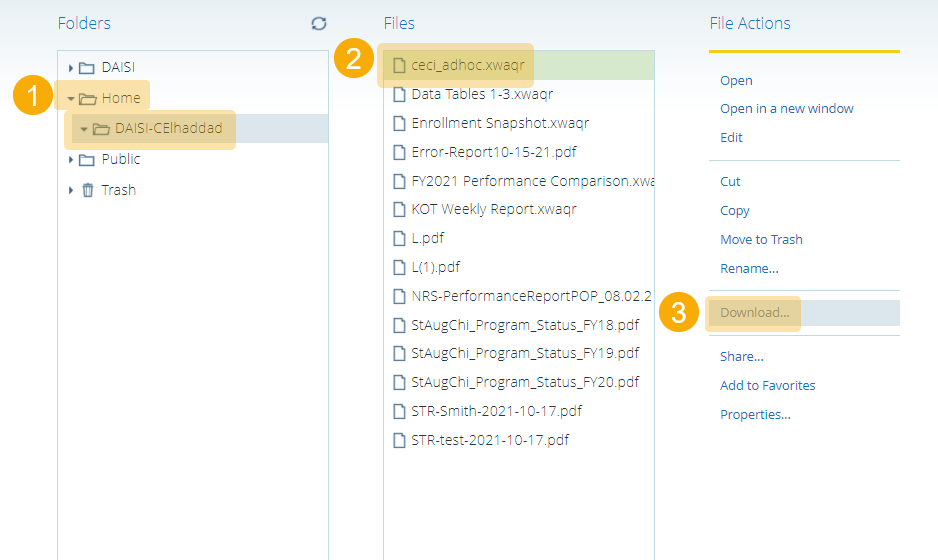
To access your saved report, return to the “Browse Files” page and:
- Open the folder in which you saved the report,
- Select the report from the “Files” pane in the center of the screen, and
- Click on the “Download” link to the right of the “Files” pane.
Your report will then download to your computer.
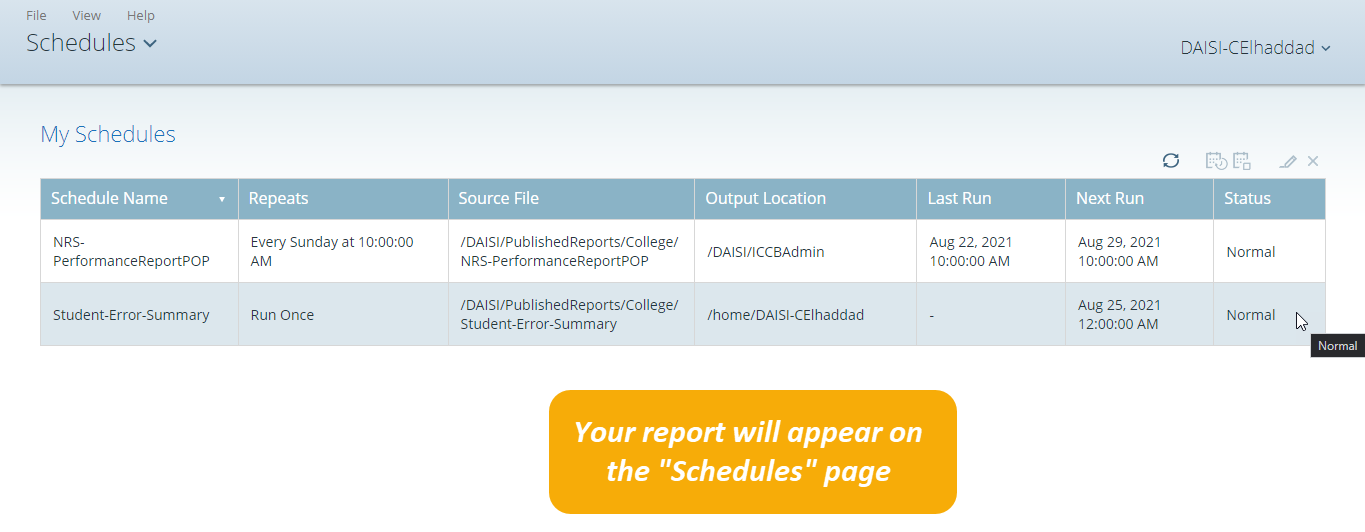
Your schedule details will appear on the “Schedules” page of Pentaho. Here, you can edit or delete your report schedules.
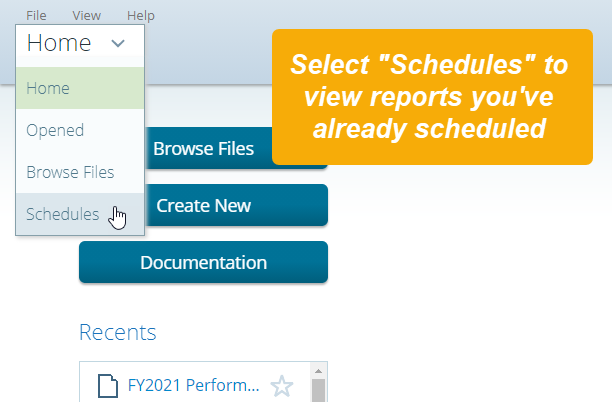
From the Pentaho Home page, you can access the “Schedules” page by selecting the last option in the drop-down menu in the top left of the screen.
Was this page helpful? Let us know.